How I Use LinkedIn Post Analytics
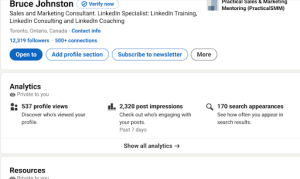
On your profile, prominently displayed near the top you will see your Analytics:
Clicking on “Show all analytics” brings this up:
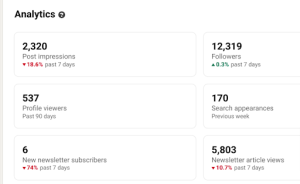
The two specific analytics I want to talk about are “Post Impressions” and “Newsletter Article Views.” Let’s take a deeper look at each of them.
Newsletter article views
These are the number of people who clicked on any of my newsletter articles in the past seven days. While most of these will be for the issue I published two days ago, there will be hundreds of people who went wandering round the one hundred or so back issues I have. I have newsletters that are five or more years old that still get a couple dozen views every week.
There are two analytics that LinkedIn will show me for my newsletters that makes the analytics worthwhile.
The first is my subscriber list. It shows my subscribers with the newest ones at the top. So I can see who has subscribed since the last time I checked in (which I do at least once a week).
The second is that LinkedIn will show me a graph of my new subscribers. I set the time period to one year (the max) and here is what I see:
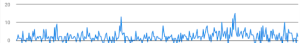
Where this is useful is I can click on the high points to find what dates those peaks were. Then all I have to do is go through my newsletter list and see what the topic was for those peak sign up dates. The result is a list of, say, the top five topics that drove the most new subscriber sign ups in the last year.
And this works – I found when I investigated the peak on the right, May was my biggest day for news subscribers and the day before, May 2, was the third biggest day for new subscribers. The topic of my newsletter that week was about the upcoming Premium Company Page offering. I never would have guessed that…it took this graph to point it out to me.
Post Impressions
This is actually an interesting one. I don’t publish “posts” per se, I really only publish newsletters on LinkedIn. However, LinkedIn appears to treat newsletters in a dual fashion. They go to my subscribers and LinkedIn puts them in the feeds of my connections and followers who aren’t subscribers too.
And a little math tells me that this is working. It is generally agreed upon that LinkedIn puts our content in front of five to seven percent of our connections when we hit “publish.” In my case that would be 600-900 people. But it says above that I received 2,320 impressions, so it would appear that I got some nice supplemental distribution.
Now, before we get all excited about all those nice impressions from the past week, let’s stop and think about the downside to impressions. A whole section of the LinkedIn cognoscenti who hate me for saying this. But hear me out and judge for yourself.
Let me show you three glaring problems with view/impression statistics.
1) You can’t see who your viewers are
Actually you can see a small subset – I can see people who have engaged (liked, commented. shared) with my content and you can bet I go review who is on those lists. But in the case of posts for example what about the 97% who don’t engage? I would love to know who they are as it would give me clues and ideas as to how I could improve my content.
2) There are no meaningful demographics
I would love to know the split between first, second or third degree connections that view my content. I would also love to see what percentages are in sales vs marketing vs other functions. And company size. And geography. Info that would help me. A raw top line number does not.
3) I have reason to believe LinkedIn can count
If the same person comes back to your post seven times to comment or look at the comment thread, guess how many times they get counted as new views? Correct. Seven times. So I know the total number of times people came around, but I really don’t know the true number of unique people that came around.
Okay, so that’s the bad news. What’s the good news?
Clicking on my 2,320 impressions shows me my top performing post was – no surprise – last week’s Newsletter.
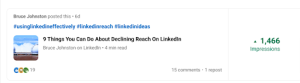
But wait a second here…if my newsletter from last week got 1,466 impressions, where did I get 2,320 in total from? Where did the other 854 impressions come from? And this is one thing LinkedIn does right. They tell me. Under my top post, there’s a list of the other posts and the impressions they received. Here are the next ones in line:
Now I have shown you all these screen grabs so you can get a better idea of what I think the three important ideas are that we can draw from these statistics.
The first is that these stats show how important it is to post on a regular basis. Instead of my one time result of 1,466 impressions, I received an additional 854 – almost a 60% increase – because I post regularly.
The second is that readers are being exposed to multiple posts of mine, not just my latest one.
And the third isn’t quite as obvious from the screen captures, but every once in a while, a newsletter will appear way out of order. Eighth on my list this week wasn’t my newsletter from 8 weeks ago, but a newsletter from 3 years ago. Having an individual issue out of place shows me topics that are more popular for one reason or another. This gives me clues as to what my readers want to see more of.
There is value in the stats that LinkedIn gives us, just maybe not in the ways that are initially obvious.